
The P-F Curve is a term pioneered and used for the first time by John Moubray, the founder of Aladon. The P-F Curve defines and illustrates the interval between a potential failure (when the failure can be detected for the first time) and the functional failure of a physical asset.
The P-F Curve represents very specific failure characteristics and defines the interval between the potential failure “P”, and the functional failure “F”. The P-F Curve is only valid for assets or components that behave technically in a way where the onset of failure is a random event and following the event provides the user with a detectable warning that the functional failure is in the process of happening or about to happen. The functional failure does not necessarily mean complete failure and is based on performance standards as defined by the user.
What is the P-F Curve?
Any equipment over time and through use will fail, as any plant or physical asset owner knows. The good news, though, is that it can take a long time between when a physical asset potentially fails and reaches the point of actual failure. The key is to fix or replace the asset or equipment before the point of failure.
The true meaning of the P-F Curve is the period between P and F, the Potential Failure (Detectable State) and the Functional Failure (Failed State). The P-F Interval is used to determine the task interval or frequency of predictive or condition-based maintenance (CBM). Predictive or CBM is mostly applied to statistically random failures.
According to Marius Basson, “When I see a P-F Curve with Preventive Maintenance and Run-to-Failure strategies combined into it or overlaid on top of it, I realize people do not understand the true meaning of the P-F Curve.”
The point or event where the failure occurs is statistically random and not necessarily related to the age of the equipment. When the failure starts, it may also not necessarily be detectable. Instead, we indicate the potential failure at the point where it is possible to detect when the equipment is beginning to fail.

P – Potential Failure – The point where it is possible to detect that the failure is in the process of happening or about to occur (not necessarily related to age)
F – Failed State – This is the point (Functional failure) where satisfactory performance standards are no longer met (not necessary the End State) and also not necessarily related to the age of the equipment
The P-F Interval is related to the time between the point where it is possible to detect the failure condition and the time when it functionally fails. Different technologies have different P-F intervals.
For example, consider the predictive maintenance for detecting bearing failures – normal wear of a roller element bearing. Following are some predictive tasks/technologies for detecting bearing failures, listed in any order:
- Vibration Analysis
- Oil Analysis (if applicable)
- Acoustic Analysis (bearing noise)
- Thermography (bearing temperature)
- Smoke
In Figure 1, F will be the Failed State and not necessarily the End State, where the Failed State may occur sooner. Nowhere on the P-F Curve does Preventive or Run-to-Failure maintenance become an alternative or choice and should therefore not be presented on the P-F Curve.
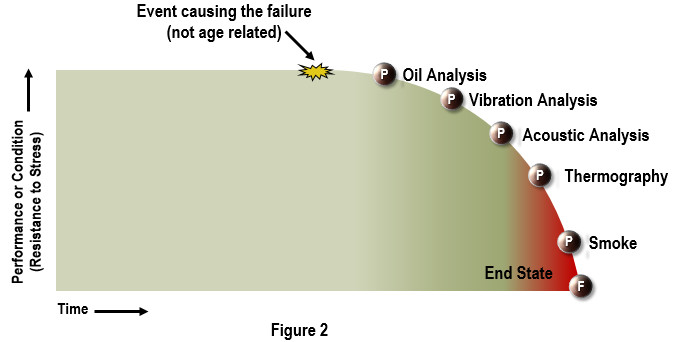
It is commonly understood that checking for smoke will mean that it is already too late to do something about the failure. Obviously, nobody will or should use smoke as an indicator. The goal is to maximize resources to prolong the P-F interval in the most economic way possible.
According to Basson, “One thing I have seen on some curves that may be true is the cost of proactive or predictive maintenance (and subsequent corrective maintenance) could increase as we move closer to the Failed State (F). The predictive task has to be done more often (shorter P-F Interval) and the time we have to minimize or eliminate the risk associated with the failure is reduced. It is generally true that the more time we have to plan and schedule corrective maintenance, the more cost effective maintenance will be. However, it is also true that the further back (away from F) we try to predict the failure, the more sophisticated the technology becomes and therefore increasing the cost of the Predictive Task(s) and Technology.”
The P-F curve does not represent preventive maintenance or Run-to-Failure maintenance, and it cannot be used together! Run-to-failure or no scheduled maintenance is a risk management strategy associated with tolerable failures or with failures where there is no detectable warning (potential failure condition) or the P-F interval is too short to be of use. Preventive maintenance at a fixed time interval for age related failures does not correspond to the P-F interval.