
The P-F Curve is a term pioneered and used for the first time by John Moubray, the founder of Aladon. A P-F Curve is a graph that illustrates the interval between a potential failure and the functional failure of a physical asset.
Today, many versions other than the Aladon version are pictured as a D-I-P-F Curve and include precision engineering (design integrity and precision maintenance), preventive maintenance, corrective maintenance and even run-to-failure, such as the example below.
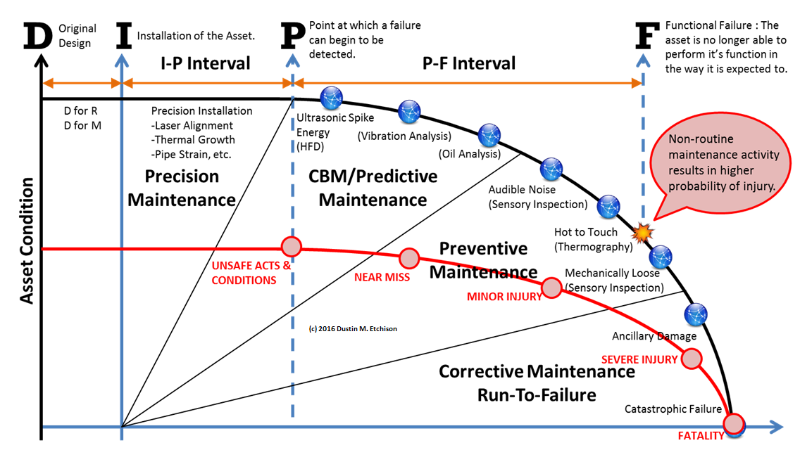
The Aladon P-F Curve does not include the elements of D-I, and there’s good reason for it. According to Marius Basson, the D-I-P-F Curve is technically incorrect and flawed, and the P-F Curve is correct as is.
The P-F Curve represents (and illustrates) very specific failure characteristics and defines the interval between the potential failure “P”, and the functional failure “F”. The P-F Curve is only valid for assets or components that behave technically in a way where the onset of failure is a random event and following the event provides the user with a detectable warning that the functional failure is in the process of happening or about to happen. The functional failure does not necessarily mean complete failure and is based on performance standards as defined by the user.
Although many argue that the potential failure and functional failure is a function of time, this is not true and therefore does not fit the characteristics of age related (use-based) or time-based failures. “The events that may cause failure also have no direct relationship to the design integrity or age of the equipment, making it technically incorrect to try and position condition-based maintenance somewhere between design and precision maintenance and preventive maintenance and run-to-failure on a combined flawed D-I-P-F Curve,” says Basson. The P-F Curve is associated with failures that give a warning or indication (potential failure condition) that the failure is in the process of happening or about to happen and not associated design integrity, precision maintenance, age related failure prevention or run-to-failure strategies. These are independent strategies and should be treated as such.
According to Basson, “One thing I have seen on some curves that may be true is the cost of predictive maintenance (and subsequent corrective maintenance) could increase as we move closer to the Failed State (F). The predictive task has to be done more often (shorter P-F Interval) and the time we have to minimize or eliminate the risk associated with the failure is reduced. If the P-F interval is too short to prevent the failure then the predictive maintenance is ineffective and it is in effect a run-to-failure strategy. It is generally true that the more time we have to plan and schedule corrective maintenance, the more cost effective maintenance will be. However, it is also true that the further back (away from F) we try to predict the failure, the more sophisticated the technology becomes and therefore increasing the cost of the Predictive Task(s) and Technology.” The P-F curve does not represent preventive maintenance or Run-to-Failure maintenance, and it cannot be used together!
D for design
The potential failure condition or position of “P” on the curve is not a function of the design integrity, and “D” does not belong on the P-F curve. Reliability-Centered DesignTM (RCD) or design integrity focuses on two important attributes (among other things): quality and reliability. Quality is defined as “initial fitness for purpose” and reliability is defined as the “continued fitness for purpose.” These attributes are necessary and inherent to well-engineered and designed assets. The majority of failures in modern plants and installations are event based and the design integrity has no or little bearing on the events that cause the onset of failure. Therefore the “D” and does not belong on the “P-F Curve.”
Quality is necessary to ensure that an asset or equipment will do what the user wants it to do right from the start, and reliability is necessary to ensure the asset or equipment will continue to function for as long as the user accepts under certain given conditions. Even the most reliable designs and installations may be subject to the events that cause failure and therefore would require monitoring or condition-based maintenance right from the start. Startup failures are not only caused by poor design and improper installation, making a “delayed P” not a technical correct depiction of the reality. Even with the utmost care during design and installation, the event causing the failure could happen at startup or shortly thereafter.
These events could strike at any time, right at startup or after many years of service, regardless of the design integrity. These events and potential failure conditions are not time-based or related to the number of cycles completed. The case can be made and it is possibly true that a well-designed and properly installed asset will be less likely to fail during startup, but it is simply not true that the events that may cause the failure are not present or even that the failure will not happen, especially when we consider complex systems. The D-I-P-F curve suggests that there is an “I-P Period” before the potential failure condition and that “P” will be pushed out based on design integrity and installation or precision maintenance (which by implication is a requirement and not a precondition). In other words, the better the design, the more time before “P.” This is misleading and incorrect.
I-P Interval (Precision Maintenance)
The “I-P interval” is not a precondition or relevant to the P-F interval as shown on the D-I-P-F Curve. As mentioned earlier, “P” is not dependent on any precision maintenance or design integrity, although that does not imply that it is not important. If “P” was dependent on and following the design integrity and precision maintenance (D-I-P interval), the airline jet engine manufacturers will not follow a predictive and condition-based maintenance strategy right from the start but delay the monitoring (checking for potential failures) until such time where they have reached the end of the D-I-P interval (whatever that may be). The airline industry was the first to realize that “P” may strike at any time.
Preventive Maintenance
Preventive maintenance (as defined by the RCM Standard) does not belong anywhere close to or on the P-F Curve. It is technically incorrect to depict that fixed time maintenance will follow condition-based or predictive maintenance. The characteristics associated with a failure that would require a preventive maintenance strategy (scheduled restoration or scheduled discard) are completely different to the failure characteristics associated with predictive or condition-based maintenance. “Optimization of maintenance tasks associated with many age-related failures can be achieved through condition-based maintenance practices (e.g. tire and V-belt replacement), but it is two separate strategies and the one does not follow the other,” says Basson. “The D-I-P-F Curve incorrectly shows that once the P-F condition has been passed (or somewhere in between there), a condition of Preventive Maintenance is entered. This is completely wrong and totally misleading.”
Preventive maintenance may actually be considered ahead of condition-based maintenance and not necessarily due to a missed opportunity to apply predictive or condition-based maintenance as the D-I-P-F Curve illustrates.
Run-to-Failure
Run-to-failure or no scheduled maintenance is a risk management strategy associated with tolerable failures or with failures where there is no detectable warning (potential failure condition) or the P-F interval is too short to be of use and the failure is not age related. In other words, condition-based maintenance and preventive maintenance is not technically feasible or where the maintenance is not worth doing (cost of maintenance exceeds the cost of the failure which it is meant to prevent).
Run-to-failure and the P-F Curve have nothing in common and should not be shown where run-to-failure follows the P-F condition and the Preventive Maintenance condition.
Run-to-failure is a strategy that is not necessarily age related and should not be shown as the end-of-life causing ancillary damage or catastrophic failure. Run-to-failure or no scheduled maintenance does not mean “no planned maintenance.” The D-I-P-F curve incorrectly depicts run-to-failure as a result of failed condition-based and preventive maintenance strategies, causing equipment damage and catastrophic failure.
A run-to-failure strategy may be the only or most cost-effective strategy, therefore the D-I-P-F Curve represents it incorrectly.
Corrective Maintenance
Corrective maintenance is not a strategy, but the remediation associated with all risk management strategies, whether predictive, condition-based, preventive, run-to-failure or functional checks (failure finding). It also should not be associated with the P-F Curve or any curve for that matter.
Design, precision maintenance and preventive maintenance more properly relate to the different failure patterns instead of the P-F curve. In actuality, the DIPF curve is a mixture of the P-F curve and the start-up and wear out failure patterns which is confusing and incorrect.


What is the P-F Curve?
The P-F Curve defines the period between the potential failure condition “P” (detectable state) and the functional failure (failed sate) “F.” The P-F Interval is used to determine the task interval or frequency of predictive or condition-based maintenance (CBM). Predictive or CBM is mostly applied to statistically random failures although optimization of scheduled preventive maintenance tasks can be achieved through applying condition-based maintenance principles. “When a D-I-P-F Curve combines design, precision installation and maintenance, with predictive, preventive and run-to-failure strategies (all following one another on a timeline), it signifies that people do not understand the true meaning of the P-F Curve or characteristics of failure,” says Basson.